Photoquadrats, that part of the RLS survey easy to discount, have been providing valuable insight into the benthic habitat at Reef Life Survey sites over the Australian continent and beyond. Many RLS divers may not know, but over the last two years we’ve had more time and resources to dedicate to the analysis of RLS photoquadrats, scoring images for over 4000 more surveys and publishing findings in State of the Environment reports, scientific journals, and the Reef Life Explorer. Detecting differences over time in the composition of benthic biota at RLS sites, from high latitude kelp beds to tropical coral reefs, and coupling this with the RLS fish and invertebrate data is revealing new understanding to how reefs are changing at continental scales.
Recently some funding was dedicated towards a short intensive photoquadrat scoring effort, dubbed the “PQ Blitz”. With the help of 4 ongoing Reef Life Survey divers we finished off scoring 588 surveys. The advantage of having experienced RLS divers was multi-faceted. It was apparent quickly that knowledge of the RLS sites and survey methods was beneficial. Divers had a keen eye for detail, motivation to produce quality data, and worked well in a collaborative team fashion. Even better participants increased their knowledge of the habitats they dive in, and were able to provide some valuable feedback. One suggestion was that it would be beneficial to share some insight with the RLS diver community on how we analyse the PQs and what aspects of image quality we can focus on when taking and processing images to send in.
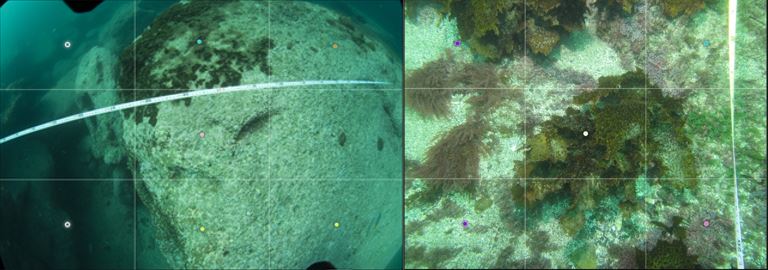
For the past two years, all the photoquadrats images sent in and successfully matched up with their corresponding surveyID have been publicly available on an online platform called Squidle+ www.squidle.org. This is over 220,000 images for over 10,000 RLS surveys. Anyone can access and analyse the images, although we encourage getting in contact for any analysis, because we’ve defined a standard process for scoring RLS photoquadrats that is mutually beneficial to utilise. The quality of data produced, and time taken to do so is optimised by having great images to work with. So, if you’ve ever wondered about the finer points to consider when taking a great photoquadrat, read on.
We know all too well the challenges how underwater time constraints and poor conditions such as swell and visibility can hamper the process of taking a perfect set of photoquadrats, yet there are some things we can aim to do relatively consistently that really help in the analysis process.
· Transect placement. When revisiting RLS sites which are surveyed each year, aim to survey the same depth contour and position as previous years, so that changes in habitat cover can be detected more meaningfully.
· Colour balance. Using a strobe or flash where necessary can help with colour balance. This is one of the attributes we cannot tweak in Squidle+, and colour, particularly distinguishing between red, green and brown can be very helpful when identifying types of algae or encrusting biota. On the other hand too much flash can produce glare.
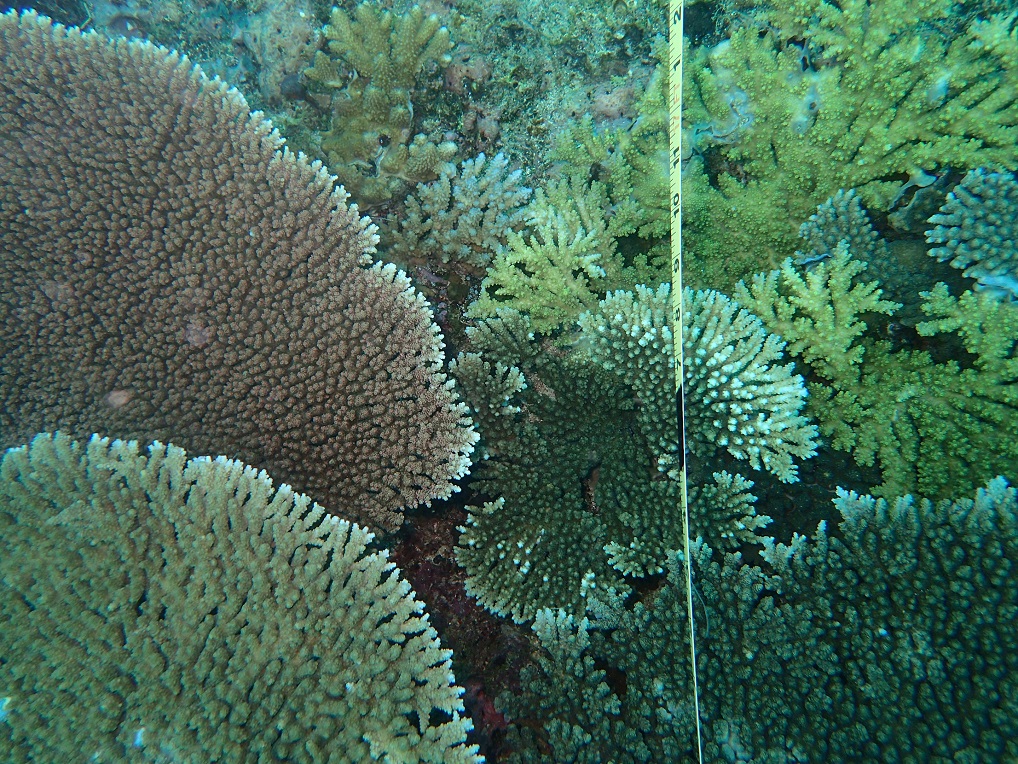
· Wide angle or fisheye lens’ can make analyses difficult. During scoring, a grid of points is overlaid on each image and the feature that each point overlays is assessed and allocated a label. Wide angle and fisheye lens can distort the outer regions of the image, meaning points there are difficult to assess, or have to be moved which slows the scoring process.
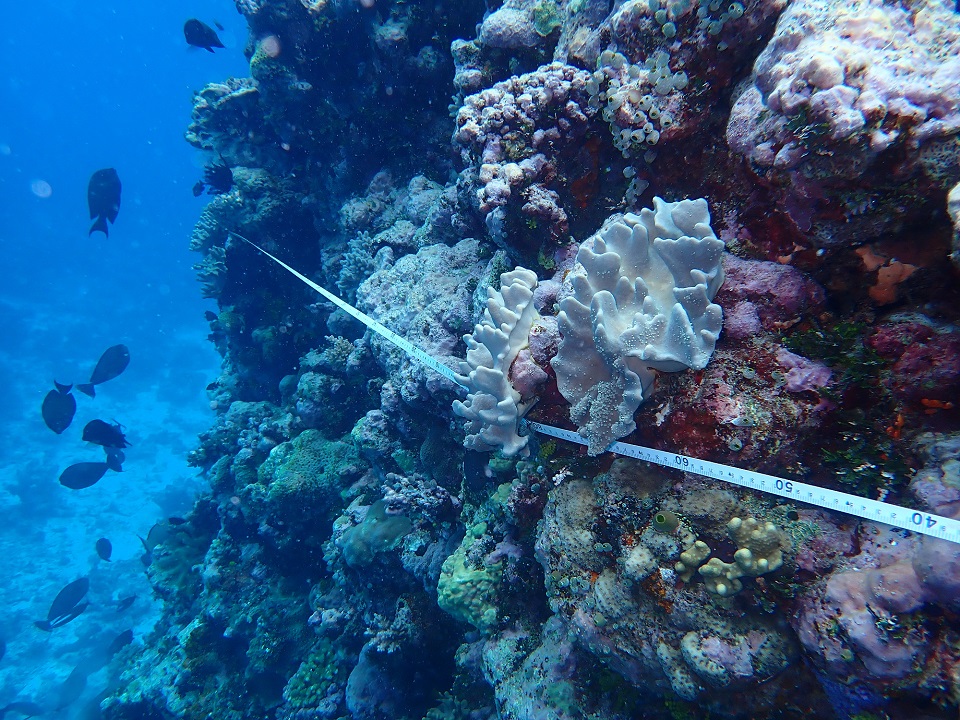
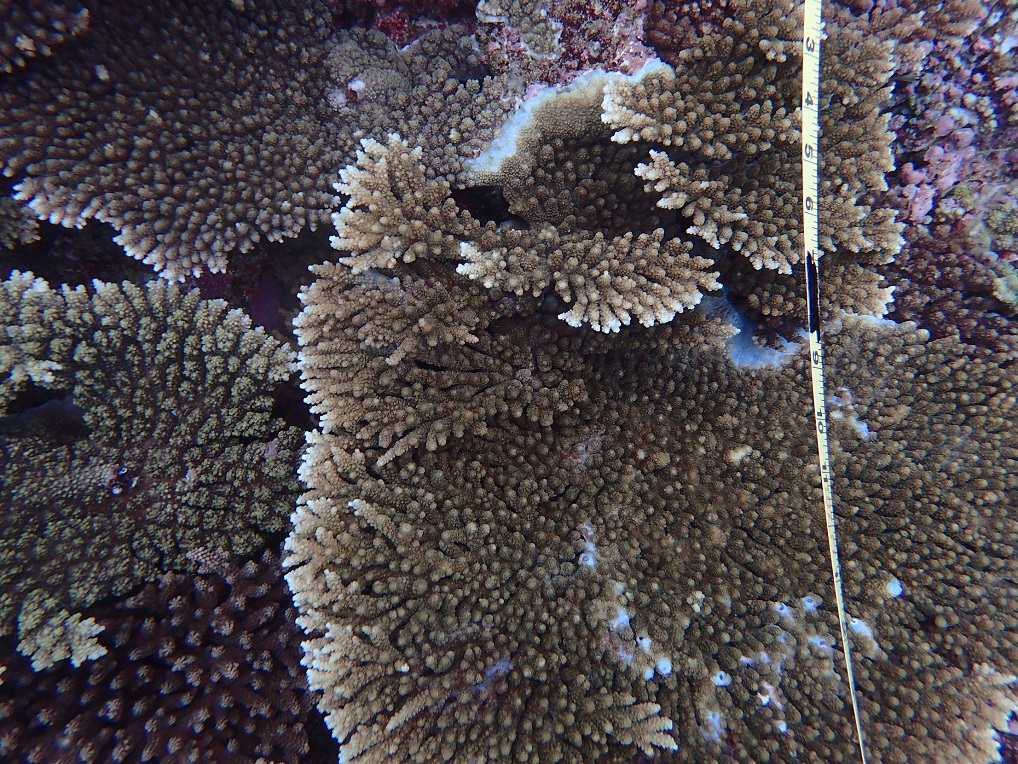
· Scale: This can be a tricky one, especially when the transect tape is not sitting flush with the reef surface, however, do your best to encompass an area of 0.3 m by 0.3m with the camera about 50cm above the seabed. Some feedback we gained is that the transect tape doesn’t need to be in the photo itself even though its helpful to use it as a reference when scaling your photo. In fact sometimes points have to be moved away when they “land” on the transect tape in an image, so if including it try composing your photo so that it’s close to the edge. This will also avoid the camera focusing on it instead of the reef or unwanted refraction/glare from the whit side on the tape.
· Resolution: Consider that we are interested in everything from canopy to encrusting biota. It is often hard to get the reef surface in focus when being pushed around by swell or current but that is often where the trickiest part of scoring is.